 |
| ||||||
Analyzing the measurements
Batscan can present all measurements in a graphical form, either as a snapshot at a specific time (record) or as trend over time. The graphical form makes it possible to get a good overview of thousands of values simultaneously and deviations from normal is easily detected without one having to be a specialist on batteries.At each measuring cycle, typically repeated every 5 second, all channels are measured simultaneously and the new value is compared to the last saved value for each channel, if a value has changed the new value is saved together with a timestamp at the computers hard disk. The level of change required for a new value to be saved is determined by a user defined threshold level, 5mV is common for cell voltage.
Measured values for each individual cell is saved with 5mV voltage resolution and 5s resolution in time during the whole lifetime of the battery. This provides data for very detailed analyses and follow-up of the battery's aging process.
For values with such high resolution to be relevant, there must be a reference value to compare with. Batscan uses a special technique to measure all channels synchronously at the exact same time. For cell voltage channels, this means that all values are valid at the same current and therefore compares correctly. The average of all cell voltages within a battery can then be used as reference for each individual cell voltage.

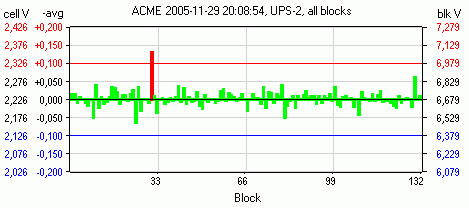
With the graphical view, any deviation from normal is easily detected.
If a value exceed the alarm threshold specified for the type of value, the visual effect is emphasized by red or blue color marking in the bar diagram.