 |
| ||||||
The Batscan Software - Graph Window

|
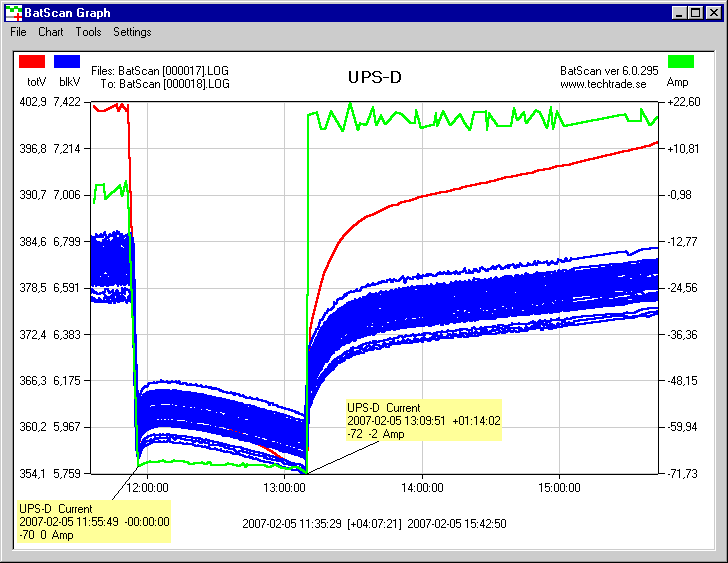
The Graph Window is typically used by service personnel to investigate a battery's response to a power failure event or a discharge test. Time range together with any individual channels, or all channels within a battery is selected in the main window for plotting, right-click on the mouse opens the Graph Window. A small textbox follows the cursor and shows the value of the nearest point. Relative measurements can be done between any two points in the graph. Channel points with time and value as well as free text is easily placed on the graph. In this graph the user has placed two yellow labels on the current channel with both absolute and relative values included. The content of the Graph Window can be printed or saved as a picture for documentation. |