Loading Data, please wait....
The Batscan Software - Main Window


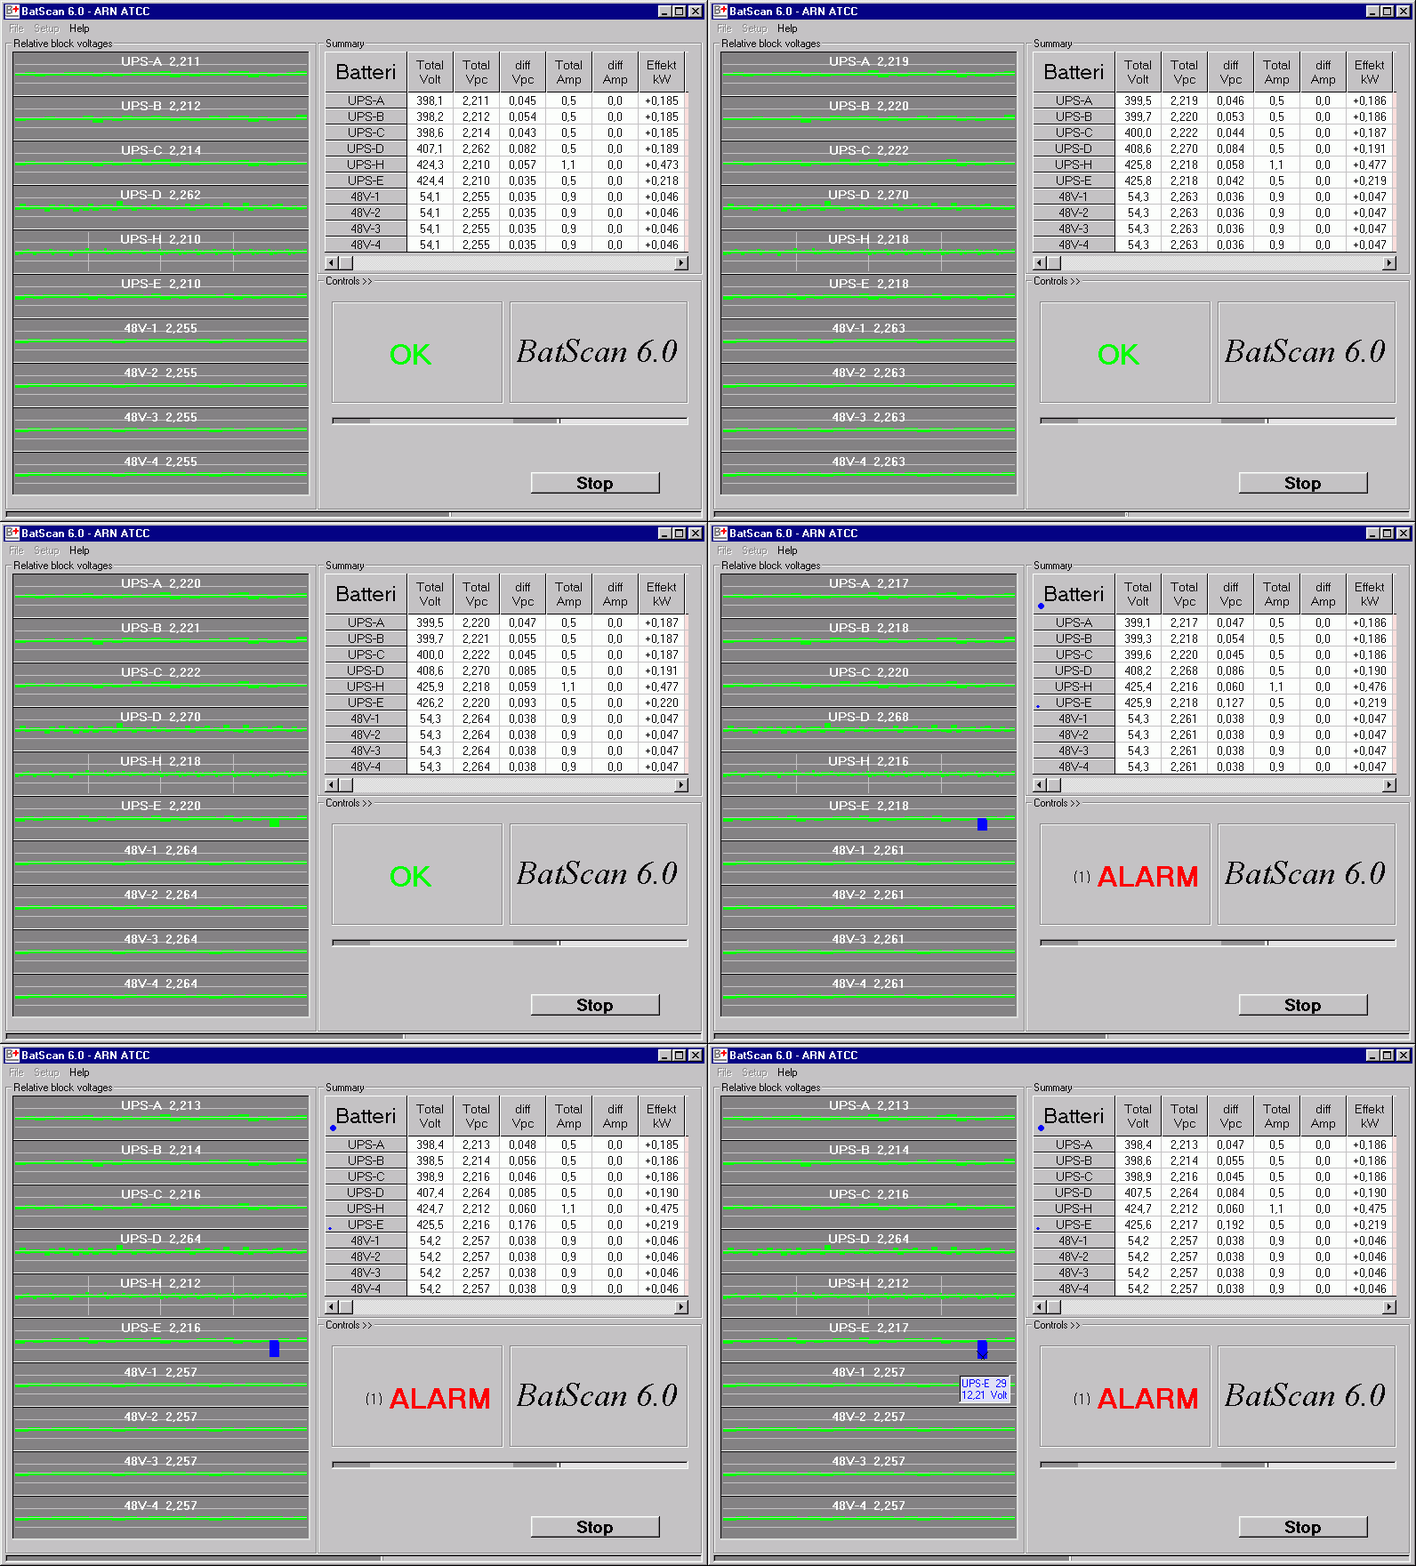
The animated screen dump above shows the main window of the Batscan monitoring software.
This site has 10 batteries of various configurations with a total of 426 monitored channels.
All values are continuously updated every 2 seconds on the operator's display, giving a real time
confirmation of the battery status.
The actual data acquisition sequence is shown as a progress bar, which serves as a status indicator for the monitoring system itself. The total length of the progress bar window represents the interval between measuring cycles (2s). On the left hand side, the dark gray field is the sampling and integration time during which all channels are actually measured in the modules (0.2s), thereafter follows a light gray field in which all the data from the measurement is collected from the modules (0.8s), the last dark gray field represents the time used by the PC to post process the received data and update the display (0.3s). A small black mark indicates the normal end of the acquisition sequence (1.3s).
The main window is divided in 3 sections each section showing battery status with
different details level;
|
Relative Block Voltages (left side): Shows details of all measured battery block or cell
voltages. The bar graph presentation gives the operator a clear view of the condition of all
individual cells in the whole site simultaneously, color marking helps fast identification of
abnormal values.
The cursor can be pointed freely at any bar to show the channel number and measured value.
In this example, the user can see that one channel is measuring below alarm threshold
and by pointing the mouse cursor at the bar a digital display will show; battery name, block number and measured value.
|
Summary section (top right): Shows an overview of the most important values per
battery with; total battery voltage, average cell voltage, difference in cell
voltages, total battery current, total battery power and number of alarms.
Colored indicators show type of alarm, red = at least one value is too high,
blue = at least one value is too low.
|
|
Controls section (bottom right): Shows either OK
or ALARM. If all monitored
channels measures within the predefined threshold OK will be shown and the
external summary alarm relay contact will be activated. In ALL other cases the
external relay will be deactivated which indicates an alarm condition to the
sites central alarm system. This includes any malfunction in the battery
monitoring system for example if the PC crashes, or if any of the channels
measures an out of limit value.
|
|
